The supporting m-files for manuscript in press (BMC Bioinformatics)
Biological sequences as pictures – a generic two dimensional solution for iterated maps
Jonas S Almeida1*, Susana Vinga2
1) Dept Bioinformatics and Computational Biology, University of Texas MDAnderson Cancer Center, Houston, Texas, USA. Email: jalmeida@mdanderson.org.
2) Knowledge Discovery and Bioinformatics, Instituto de Engenharia de Sistemas e Computadores Investigação e Desenvolvimento, Lisboa, Portugal. Email: svinga@kdbio.inesc-id.pt.
are provided here.
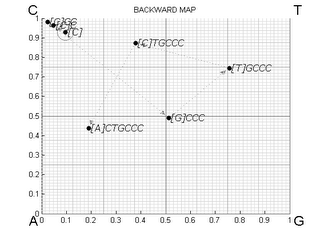
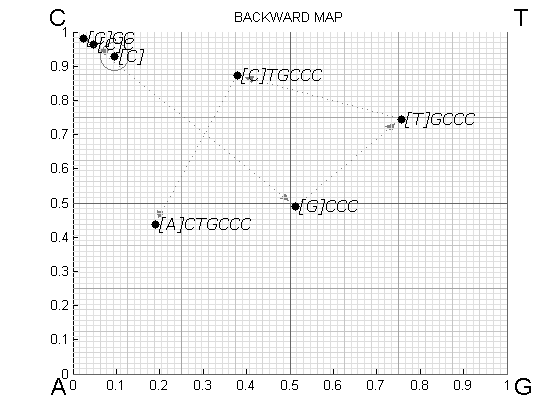
The command that starts the GUI depicted in Figure 1 is "nCGR".
The command to calculate the map increment (Equation 2) is "salto". The same commend for the preceeding solution (equation 1) is "salto_fiser". To reproduce the plots in the reamining figures you can generate random sequences using "uni_randa" and the use "n_gon_plt" :
>> help n_gon_plt
N_GON_PLT plots n-gon assembled by CREATE_DT
alternatively the string may be submitted directly
in which case a seccond optional input argument can be used to specify
the increment
Syntax: function y=n_gon_plt(dt,inc)
Examples
a) submit sequence
n_gon_plt('qwerqerqewrqerqrqewrqwerqwerqwrqwerqwerqrqewrqeerwretrwertwtwrw
rtrtwr');
b) build structure first
str='qwerqerqewrqerqrqewrqwerqwerqwrqwerqwerqrqewrqeerwretrwertwtwrwrtrtwr';
dt1=create_dt(str);
dt2=create_dt(str,0.7);
figure;subplot(1,2,1);n_gon_plt(dt1);subplot(1,2,2);n_gon_plt(dt2);
Jonas Almeida, Jan 2009, jalmeida@mdanderson.org
Tuesday, February 10, 2009
Monday, March 19, 2007
1) Mission Statement
Since its original proposition by HJ Jeffrey in the early 90's, Chaos Game Representation (CGR) has been intriguing a small number of researchers as a generalized representation of Markovian processes. After an initial period where the graphical appeal of the technique took precedence over its deeper properties, it was shown that indeed Markov transition is a special case of CGR rather than the opposite as proposed soon after the original publication (see that link for an historic overview of the first decade of CGR work). That conclusion creates the opportunity to revisit basic concepts of pattern recognition in symbolic sequences that are particularly relevant to the analysis of Biological sequences. That domain is particularly interesting because it is well understood that Biological function has a dependency on sequence that takes place, simultaneously, at multiple scales. For example, single nucleotide mutations can have a drastic effect in gene expression and so does Chromatin organization. GENECHAOS.ORG (this resource) is created as a collaboratorium open to researchers in this field.
Monday, October 16, 2006
Density Kernel Toolbox
Companion Toolbox to
Almeida, J.S., S.Vinga (2006) Computing distribution of scale independent motifs in biological sequences. Algorithms for Molecular Biology. 1:18. [PMID:17049089].
link for USM tbox
The main function of this MATLAB library is usm.m, which has detailed help documentation including examples of usage.
Another way to learn about the toolbox and particularly the use of its graphic display capabilities is to generate the four figures in the manuscript by using paper_fig(#), where "#" stands for the figure number (there are 4).
e.g. to generate figure 1:
>> paper_fig(1)

Subscribe to:
Posts (Atom)